Graphs in self-care

Graphs in self-care

Exploring graph designs in mental health and wellness apps

Exploring graph designs in mental health and wellness apps

Data visualization plays a crucial role in self-care apps. For my master's thesis, I explored the effectiveness of various graph designs by testing 8 versions of a mental health web app. Results showed positive influences on self-reflection and emphasized the value of contextual design.

project duration

Jul 2020 - Dec 2021

team

Myself

what i did

UX research

UI design

tools

Adobe XD

Adobe Illustrator

RStudio

Graphs in self-care

Exploring graph designs in mental health and wellness apps

Data visualization plays a crucial role in self-care apps. For my master's thesis, I explored the effectiveness of various graph designs by testing 8 versions of a mental health web app. Results showed positive influences on self-reflection and emphasized the value of contextual design.

project duration

Jul 2020 - Dec 2021

team

Myself

what i did

UX research

UI design

tools

Adobe XD

Adobe Illustrator

RStudio

what sparked my curiosity?

Graph designs in wellness apps can impact how users understand them.

Graph designs in wellness apps can impact how users understand them.

However, there was a gap in research on how various factors influence this effect. I took an exploratory approach and looked into how differently framed graphs affected users' self-efficacy – their belief in their ability to perform certain actions – and their actual behaviors.

Positive framing

80% LEAN
meat

vs

Negative framing

20% FATTY
meat

Goal framing

=

vs

Loss framing

Norm framing

vs

No norm framing

the question

How does graph framing in mental health apps impact user's self-efficacy and their actions towards maintaining their mood and a healthy lifestyle?

How does graph framing in mental health apps impact user's self-efficacy and their actions towards maintaining their mood and a healthy lifestyle?

the experiment

Testing 12 graph designs through a mood and health goal tracker

Testing 12 graph designs through a mood and health goal tracker

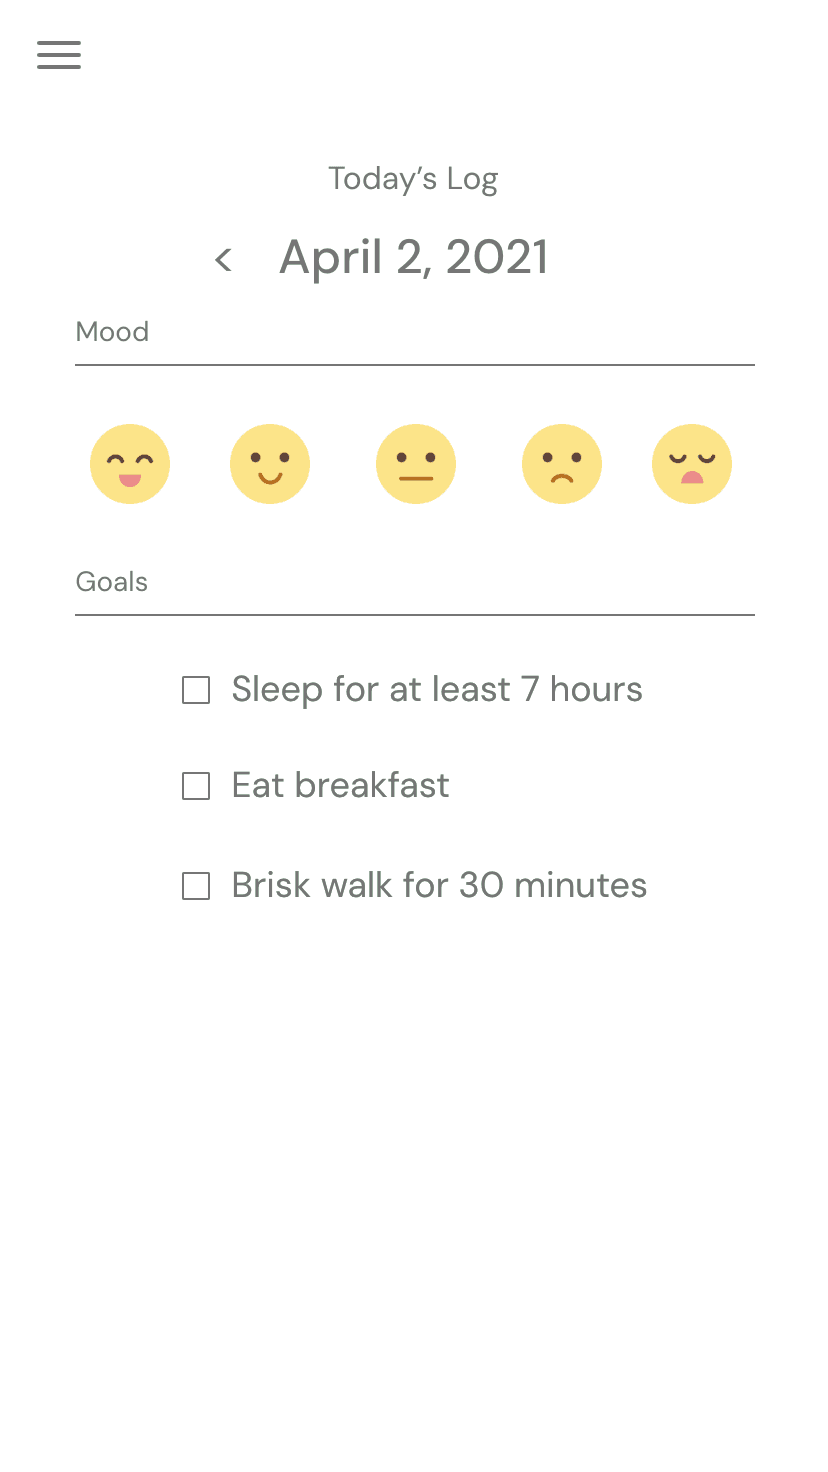
Mood and health goal tracker

Mood and health goal tracker

58 users tracked their mood and three health goals – eating breakfast, sleeping for at least 7 hours, and brisk walking for 30 minutes every day.

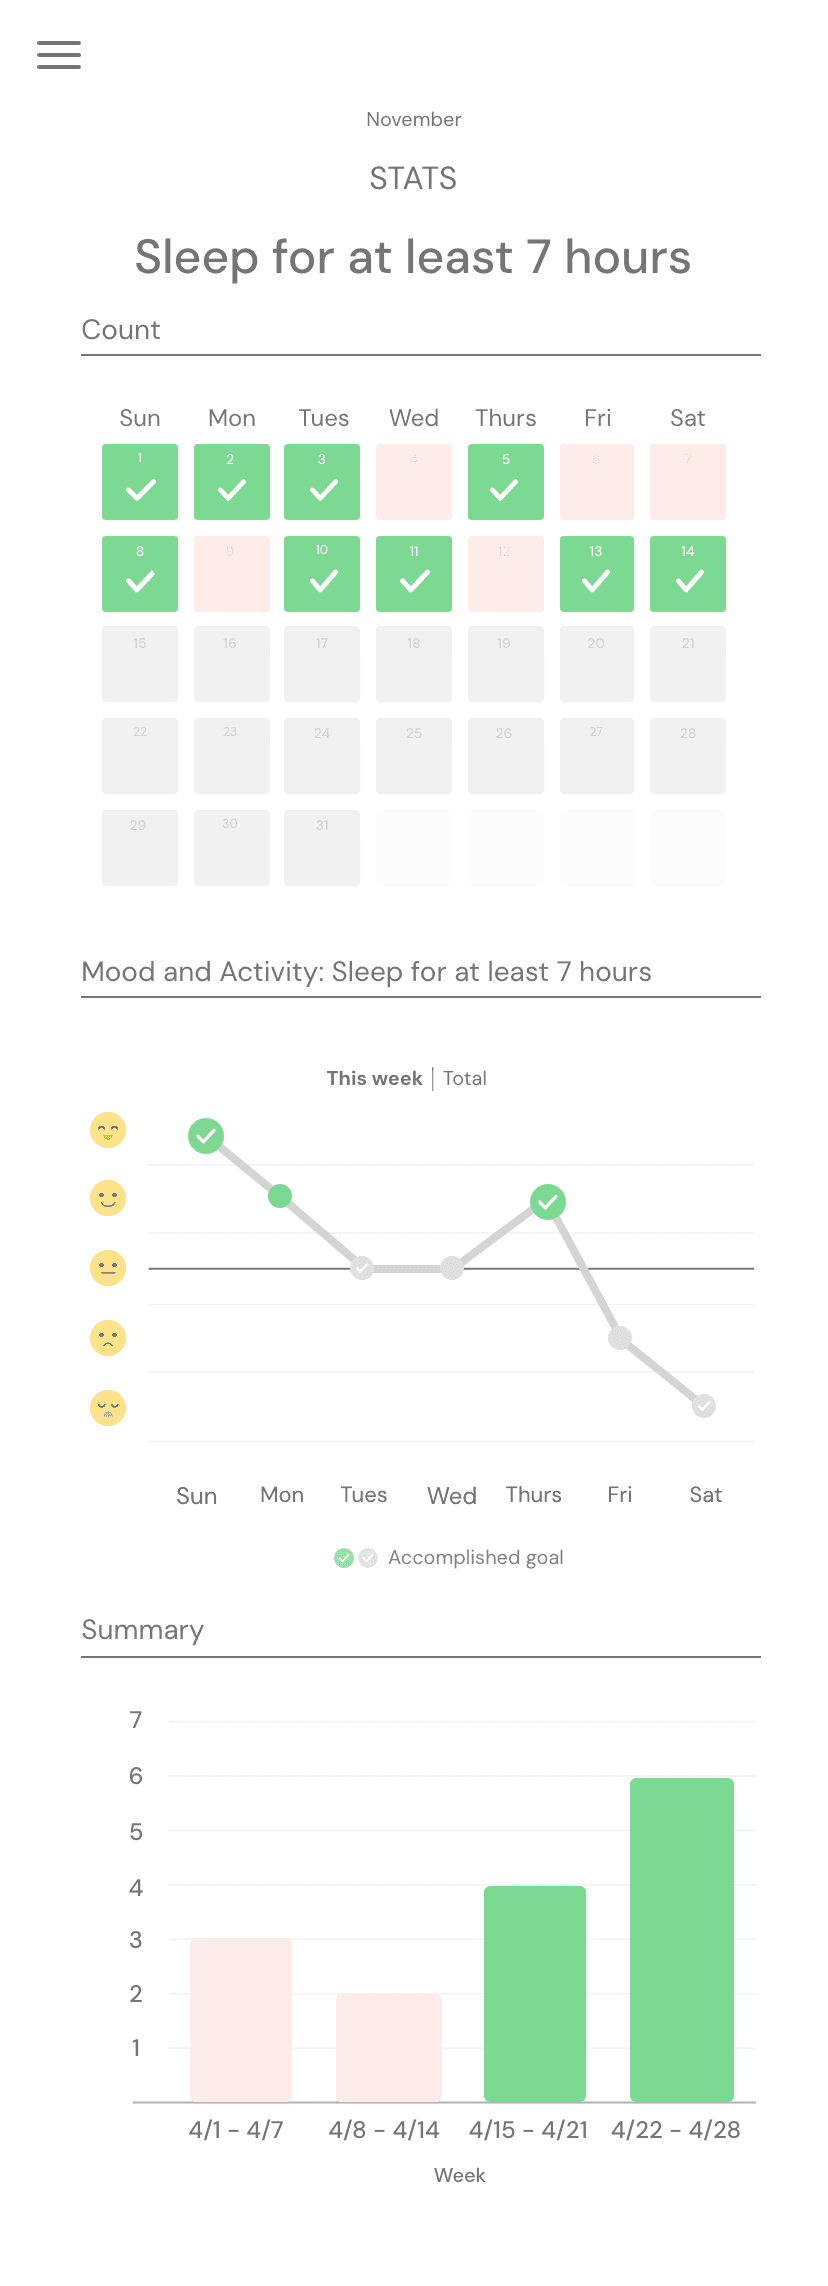
Stats

Stats

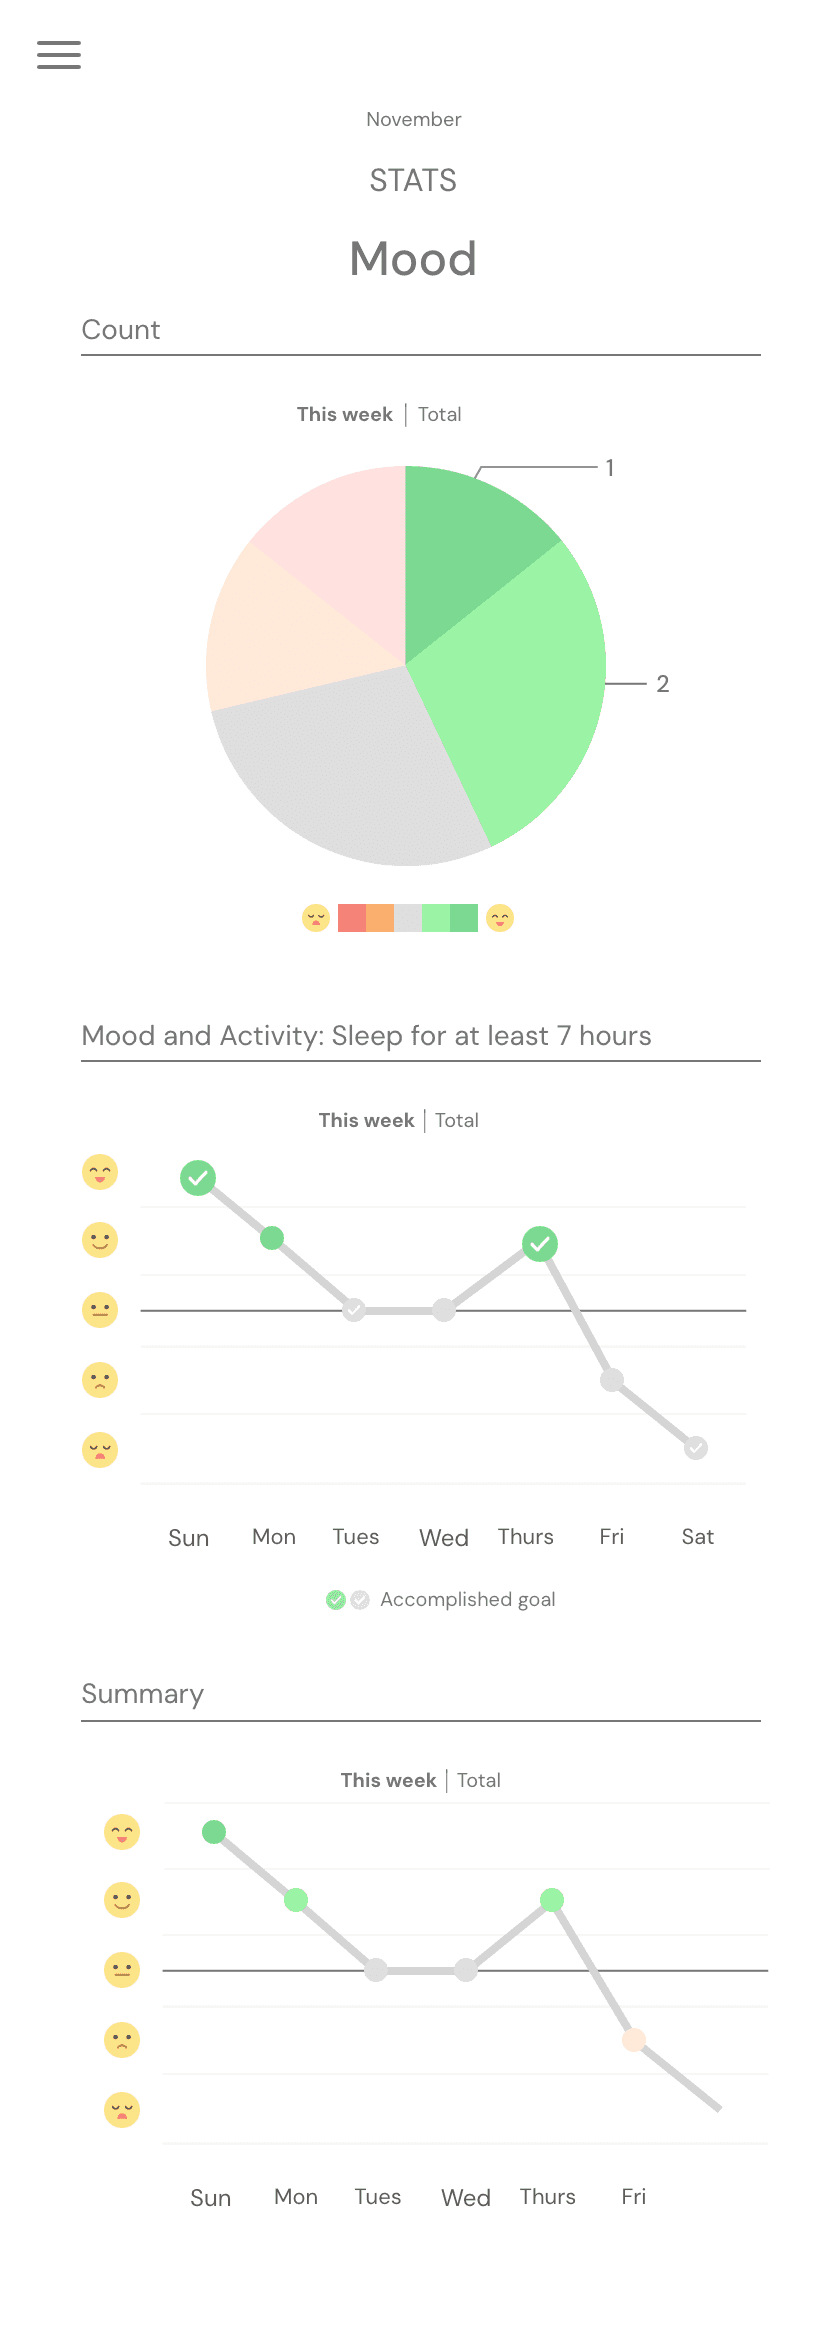
Depending on the group they were assigned to, users viewed a set of graph that gave an overview of their mood and activities.

results and impact

Contextual influence of graph designs

Contextual influence of graph designs

While there were no significant effects involving other behaviors, the influence of graph designs on users differed when it came to maintaining high mood levels and sleeping sufficiently.

Positive feedback for self-reflection

Positive feedback for self-reflection

Post-surveys showed that the graphs helped users become more aware of their daily behavior, serving as motivation to strive to perform healthier actions.

the longitudinal test

A 4-week study among 58 participants

A 4-week study among 58 participants

The mobile web app, developed using d3 and React.js, served as a wellness management platform. 58 students aged 18 and above were asked to use one version of the web app continuously for 4 weeks.

1

Pre-tracking

1

Pre-tracking

Questionnaire about self-efficacy to maintain mood and perform healthy activities

2

Tracking period

2

Tracking period

Daily use of the mobile web app for 4 weeks

3

Post-tracking

3

Post-tracking

The pre-tracking questionnaire with additional items involving user feedback

A combination of differently framed graph designs

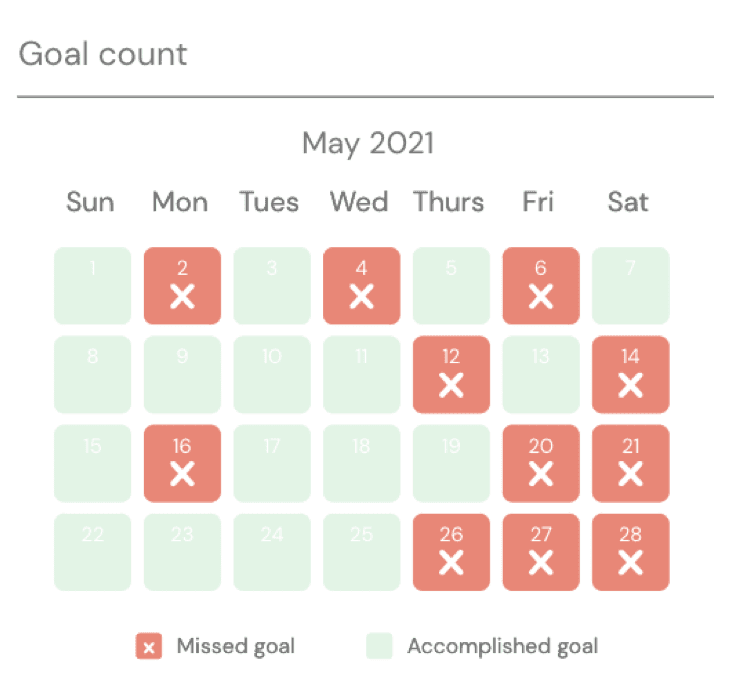
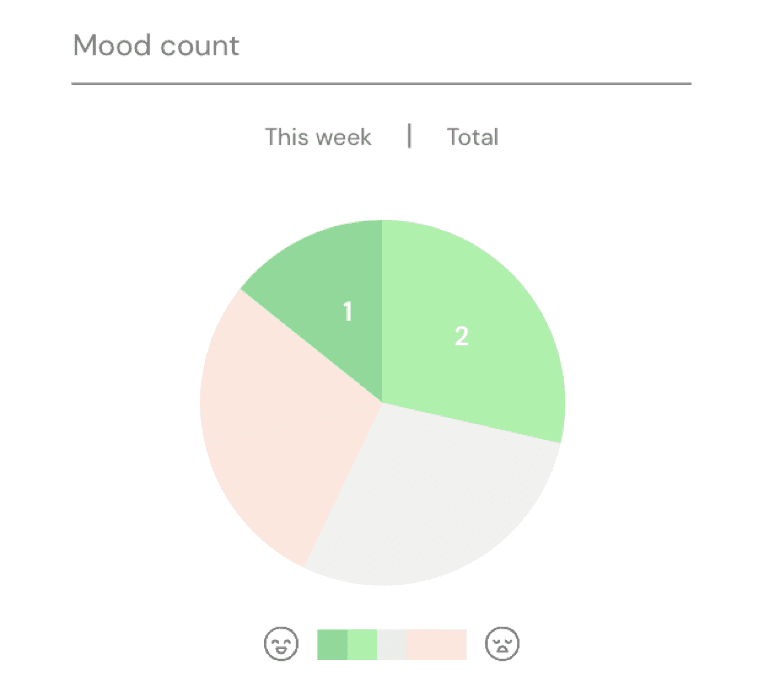
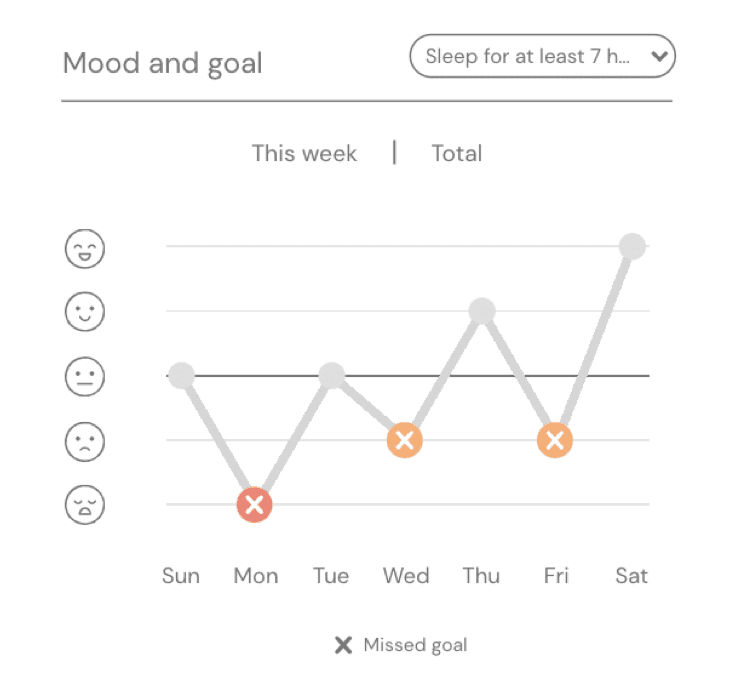
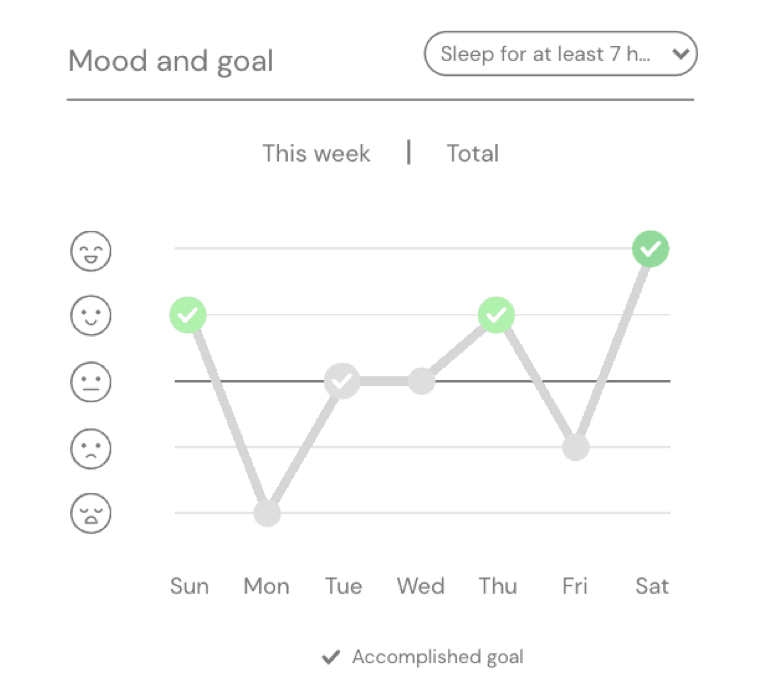
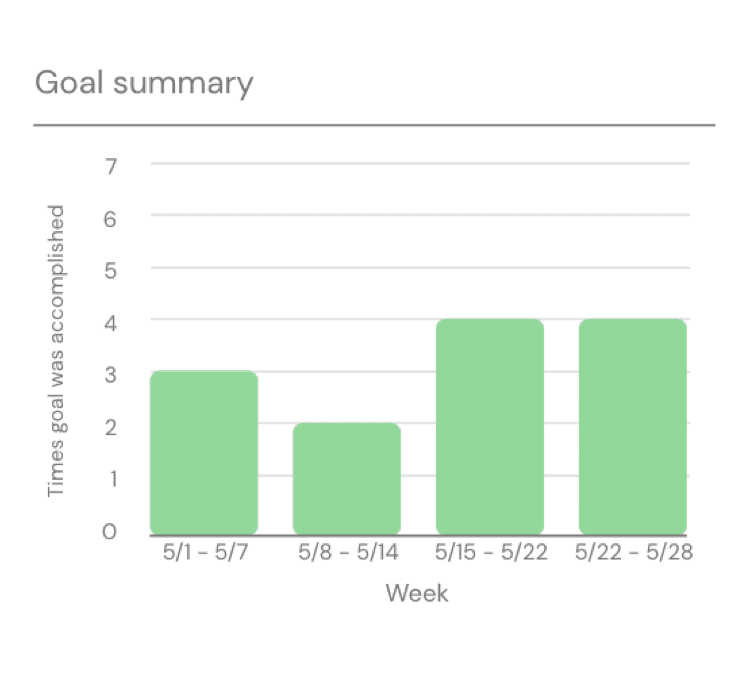
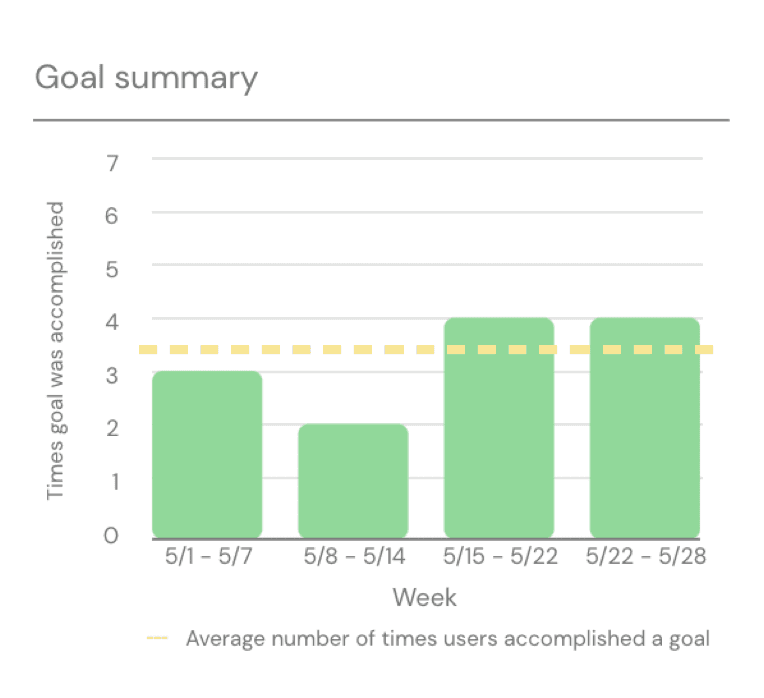
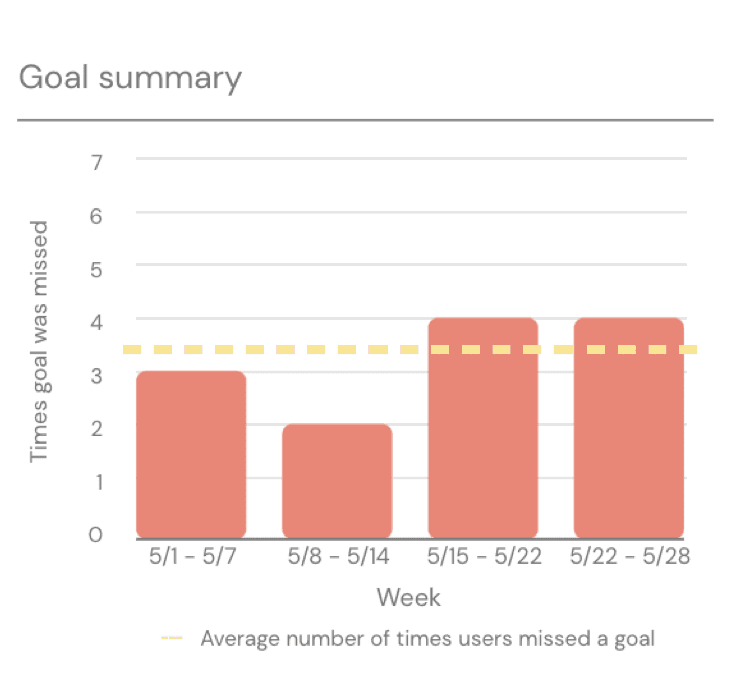
There were 8 versions of the app, each one consisting of a set of graphs that differed based on the information highlighted.

Negative framing

Low moods and missed activities emphasized (in red/orange)

Positive framing

High moods and accomplished activities emphasized (in green)

Loss framing

Emphasis on missed goals through size and cross marks

Goal framing

Emphasis on accomplished goals through size and check marks

No norm framing

Absence of norm line

Norm framing

Norm line present (average of all users)

the results

Graph effects differed when it involved maintaining mood and sleeping sufficiently.

Graph effects differed when it involved maintaining mood and sleeping sufficiently.

Positively framed graphs were more effective for mood maintenance, while negatively framed graphs were more effective for sleeping sufficiently.

Positively framed graphs were
more effective for mood maintenance, while negatively framed graphs were more effective for sleeping sufficiently.

In both instances, results suggest that graphs that highlight the advantages from taking action without bringing up social factors were more effective.

In both instances, results
suggest that
graphs that highlight the advantages from taking action without bringing up social factors were more effective.

When users didn’t think they could maintain a good mood or sleep for at least 7 hours, they were more likely to be affected by how they viewed their data, leading to either better or “poorer” performance.

When users didn’t think
they could
maintain a good mood or sleep for at least 7 hours, they were more likely to be affected
by how they viewed their data, leading to either better or
“poorer” performance.

Regardless, users found that the web app helped them reflect about what was essential to a happier, healthier lifestyle.

Regardless, users found that the web app helped them reflect about what was essential to a happier, healthier lifestyle.

what's a possible reason behind this?

The Perceptual Control Theory (1960)

The Perceptual Control Theory (1960)

Some people could have had exerted less effort achieving the health goals because of the belief that they were already doing well. This was the case for some participants, who mentioned that the graphs made them realize they had to work harder because they weren’t achieving their goals enough.

“I felt that seeing my stats helped me realize that I wasn't achieving my goals and that I should make an effort to achieve them.”

takeaways

Taking an exploratory approach

Taking an exploratory approach

With how mental health and wellness apps typically incorporate different activities together, there is still huge opportunity to dig deeper into the best combination of framing and graph designs.

The risks of longitudinal testing

The risks of longitudinal testing

Participant attrition is a significant risk in a longitudinal study. Understanding how to compensate for this by including qualitative methods can help maintain the quality of research insights.

anyway, don’t be a stranger ⊹

If you want to chat about my work, possible collaborations, or anything under the sun, come say hi!

designed from scratch by margaux lim with ₊⊹

anyway, don’t be a stranger ⊹

If you want to chat about my work, possible collaborations, or anything under the sun, come say hi!

designed from scratch by margaux lim with ₊⊹

anyway, don’t be a stranger ⊹

If you want to chat about my work, possible collaborations, or anything under the sun, come say hi!

designed from scratch by margaux lim with ₊⊹

A combination of differently framed graph designs

There were 8 versions of the app, each one consisting of a set of graphs that differed based on the information highlighted.

Negative framing

Low moods and missed activities emphasized
(in red/orange)

Positive framing

High moods and accomplished activities emphasized
(in green)

Loss framing

Emphasis on missed goals through size and cross marks

Goal framing

Emphasis on accomplished goals through size
and check marks

No norm framing

Absence of norm line

Norm framing

Norm line present (average of all users)